

This post details the budget, design, and rationale for funding Edmonton’s Bike Plan implementation.
For information about how to ensure it happens, see our other post.
What is the Bike Plan?
The City released its updated Bike Plan in 2020, replacing the previous the Bicycle Transportation Plan from 2009. The Bike Plan provides high level strategic direction for how bike infrastructure is designed and operated, but doesn’t get into a lot of specifics. In February 2022, the Urban Planning Committee of Council approved the Bike Plan Implementation guide, which goes into more detail on priorities. The Committee then asked for options to fast-track its implementation.
Importantly, the options, presented in September, lay out high level District Connector routes, a city-wide network of all-ages and abilities bike routes that would connect the many disjointed areas of the city. The options also identified priority areas with significant latent demand for better bike infrastructure.
Neither document specifies the exact type of infrastructure to use on each route, but rather define how routes are prioritized and integrated with other projects, and the processes around design and engagement. Bike routes must achieve the goals of supporting all ages, abilities, and seasons, and being integrated with the rest of the bike network. Individual route designs will depend on context.
In September, the Urban Planning Committee voted unanimously for funding options to be presented to Council for discussion during Capital Budget debates in November and December.
Why should we fund the Bike Plan?
Everyone rides easy with bike infrastructure: it relieves congestion with a connected, comfortable system of protected bike routes that allows people on bikes to travel safely without inconveniencing drivers and walkers.
Good bike infrastructure doesn’t leave bike riders, motorists or pedestrians to navigate incomplete connections that force everyone into unsafe and confusing situations.
Providing options for people to drive, take transit, walk and cycle, helps us move forward together by relieving traffic congestion, increasing mobility and opportunity. The result is a city that is more alive and livable, and more productive.
We can have peace on the road when everyone has their piece of the road.
Drivers, walkers and bikers can get where they are going with the greatest safety and the least amount of hassle because everyone’s traffic needs are met.
Employers Need It, Business benefit
Engineering giant Stantec donated resources to help design Edmonton’s downtown bike network in 2016. The business needs to attract and retain employees at its downtown headquarters, and employees didn’t want to have to drive and park downtown. Fewer people driving downtown makes driving easier for everyone else: those who still drive will find cheaper, more plentiful parking and less congestion.
Major employers compete to attract talent from an increasingly mobile workforce, and a city’s quality of life, and not just how cheap it looks, plays an important role in attracting investment and employers. More employment generates revenue and benefits everyone.
The Downtown Vancouver Business Improvement Association says, "Many employers, especially those in the tech sector, are interested in office spaces that accommodate different types of transportation, such as cycling or car sharing. They want those options available so it's easy for their employees to get to work by bike or transit or to be able to walk to work… it provides us with a competitive edge."
Toronto's Bloor Street Bike Lane Pilot found "Total customer spending in the Bloor Street pilot [bike lane] area increased more than in the area surrounding the pilot and more than in the Danforth Avenue control area", based on customer spending analysis from Moneris Solutions.
A Bloor West Village study found that people who don't drive visit the area far more often, and spend far more each month, than those who drive.
Retail sales along protected bike lanes improved in New York City compared with similar streets without bike lanes
Individuals Save Money
Cars are expensive, with the average cost of car ownership in Canada exceeding $11,000 per year. Investing in bicycle and pedestrian infrastructure and improved transit saves people money. That saved money allows them spend more money on other needs, and more money stays in the local economy.
Government and Taxpayers Save Money
Automobile infrastructure
The projected cost of the 50 St overpass and widening project from 90 Ave to Sherwood Park Freeway, an 800m section road, is $180 million dollars. It carries 24,000 vehicles per day, for an average cost of about $9,350 per vehicle per km.
In contrast, $2.3 million was spent on the 7.3km downtown bike network, including downtown beautification. (An additional $4.2 million was spent to update the overall downtown traffic signal network, which was nearing 4 decades in age, which led to the reported $6.5 million total cost of the network.)
At the time, with counters recording 4,711 bicycles per day, that worked out to a cost of just $63 per bicycle per km.
Many road widening projects would not be necessary if we managed to convert even a small percentage of trips from private vehicle to other modes. Less than a decade after opening, the province is already spending another $100 million to widen Anthony Henday Drive due to induced demand.
Automobile infrastructure is very expensive. Cities accumulate infrastructure debts that they can’t afford due to roads, leading down the path of bankruptcy.
In contrast, transit, walking and cycling infrastructure offer excellent return on investment.
A U.K. government report found the average benefit-cost ratio for walking and cycling projects delivers benefits that are 13 to 35 times the cost.
New Zealand transport planners estimate money spent on high-quality cycling infrastructure yields benefits between ten and 25 times the costs.
In Edmonton, the average annual cost for repairs and general maintenace of active pathways, including bike lanes, is just $178 per km. That means the entire 15 km of protected bike lanes in Edmonton in 2020 cost about $2670 to maintain.
Meanwhile, Roadway Asphalt Repair Maintenance cost $1,285/km. Edmonton has nearly 12,500 lane km of roadways that it maintains.
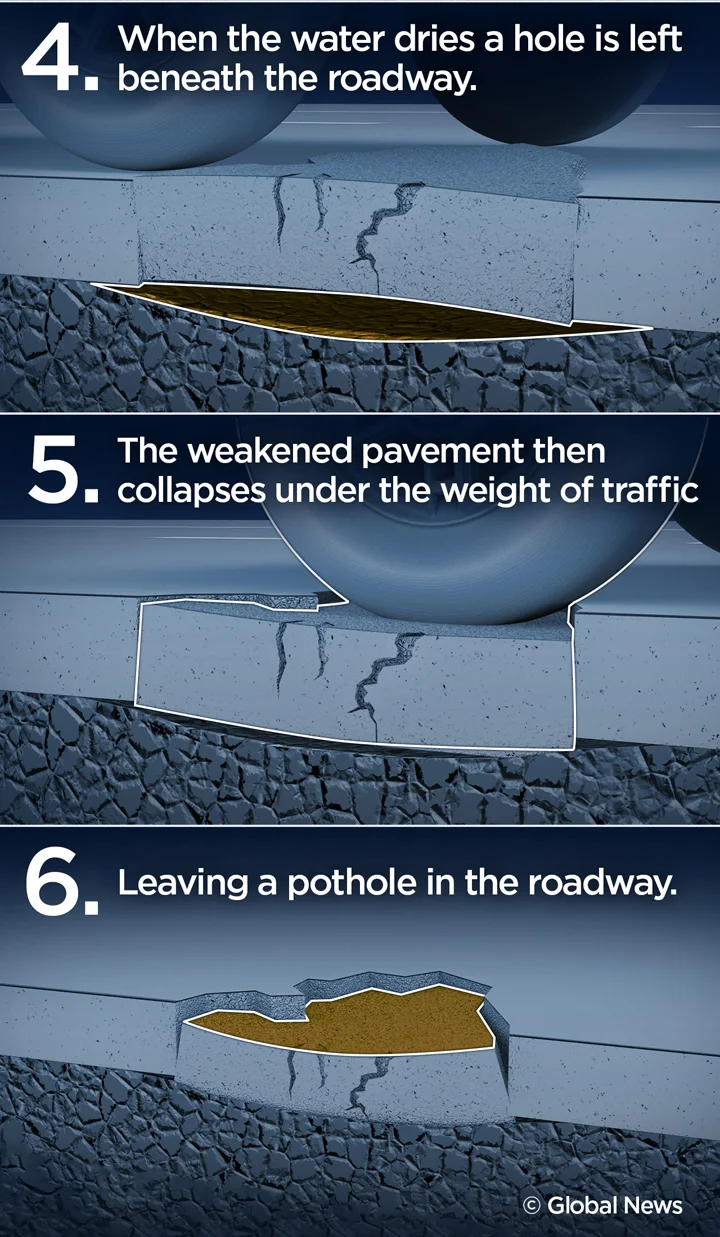
Potholes
Road damage caused by vehicles is exponentially related to vehicle weight.
A vehicle that weights three times as much causes approximately 80 times as much damage to the road. A loaded truck that weighs nine times as much as an unloaded truck much will cause 5000 times the road damage!
In 2021, Edmonton repaired 740,000 potholes, and is anticipating three times as many for 2022. Each pothole repair costs about $12.
Happier, Healthier
Do you love your commute? You probably do if you walk or bike. A Statistics Canada survey found that 66% of people who cycle or walk to work are “very satisfied” with their commutes.
43% of Albertans are not getting enough physical activity to achieve health benefits. Incorporating activity into existing daily routines, like getting to work or running errands, can decrease incidence of chronic disease and illness.
A five-year study of 263,450 UK commuters, published in the British Medical Journal in 2017, found regular cycling cut the risk of death from any cause by 41%.
Protected bike lanes reduce risk of injury by 90%. Good infrastructure also encourages more people to cycle: when Edmonton’s downtown bike network opened in 2017, cyclist counts immediately doubled from the previous year, and volumes corresponded to about 12% of the car traffic.
Calgary’s bike lane network also led to an increase in the number of women riding, nearly doubling in some locations in just a matter of months.
Policy
The City of Edmonton (and Council) has approved a number of policies and strategies, many of which they are legally obligated to follow, which support the Bike Plan.
These include:
Common concerns
Who pays
A common misconception is that people who bike don’t pay their fair share.
As shown above, automobile infrastructure is very expensive, and is paid for by Edmonton’s Capital and Operating Budgets. The majority of the money in these budgets ($1.81 billion in capital spending on roads) comes from municipal property taxes, which are paid by everyone in Edmonton, including renters, who pay via their landlord.
This means that roads are paid for by everyone, regardless of how often they drive a car. It also means that people who drive less, or cannot afford a car, are subsidizing the cost of roads for those who do drive.
Drivers do pay for insurance, which is profit for private companies and does not pay for roads.
Drivers also pay registration fees, which goes to the provincial government. Motor vehicle registration roughly runs on a cost recovery basis (paying for itself, but not much more).
Drivers also pay a fuel tax. Alberta’s 2021-22 budget planned for approximately $747 million in gasoline taxes, $570 million in diesel taxes, and about $33 million in other fuel taxes. However, Alberta also has tax expenditures of $327 million on fuel subsidies (Tax Exempt Fuel User program, farm fuel benefit, and others). $571 million in spending was allocated for capital maintenance & renewal for provincial roads and bridges, plus $926 million on provincial road expansions. None of these roads are municipally controlled (i.e. Edmonton’s budget doesn’t pay for them).
Alberta also suspended its fuel tax in April 2022, reducing revenue to $0.
Transportation plans to spend another $1.1 billion on operations for provincial highways, and $103 million on ring road debt servicing. Other expenses include $31 million on motor vehicle accident claims, and $13 million on motor vehicle registries.
The net result was $3.04 billion in spending on provincial roads, with less than $1.8 billion in revenue, and a deficit in excess of $1.16 billion. The deficit will balloon by another billion dollars or so with the suspension of provincial fuel taxes.
Again, that was just for provincial roadways: none of that spending was for Edmonton’s roads.
Some of the federal gas tax revenue is returned to Edmonton in various grants. The majority of this funding is spent on LRT.
The net result is that drivers rely on people who drive less, or don’t drive at all, to help pay for the roads, and every time someone chooses to ride a bike or walk, they are reducing costs for other car drivers and saving tax dollars, even while still paying for the roads.
If walking costs you $1, we all pay $0.01. If biking costs you $1, we all pay $0.08. If bussing costs you $1, we all pay $1.50. If driving costs you $1, we all pay $9.20. Via @thediscourse study.
— Brent Toderian (@BrentToderian) March 26, 2022
This isn’t just about choice. It’s about who pays for your choice.#citymakingmath pic.twitter.com/xjFyxBeStQ
Weather
In the past decade, the average daily high in Edmonton in January (the coldest month of the year) has been -3.5°C.
Edmonton has a dry climate, and therefore also has relatively little snowfall compared to other winter cities: Montreal, named the best major city for cycling in North America, and frequently the only North American city to rank in the Copenhagenize Index, receives 70% more snowfall than Edmonton. (Ask any cross-country skier and they’ll know: we don’t get a lot of snow.)
Minneapolis, which has also previously been ranked as the #1 Cycling City in the US, has an almost identical climate to Edmonton: it averages just 1°C warmer, and sees slightly more snow than Edmonton.
Much colder and much snowier places have made successful investments in cycling: in subarctic Oulu, Finland, which only sees an average of 15 minutes of sunlight across the entire month of December (not per day!), has a cycling mode share of 32% in summer and 12% in winter.
In Edmonton in 2015, before Edmonton opened its bike lane network or committed to maintaining bike routes in winter, 1 in 6 people who rode in the summer continue to ride in the winter. Calgary, which opened its bike lane network in 2015, retains about 1/3 of its ridership through the coldest parts of winter. Calgary receives more snow than Edmonton.
“But we are a winter city.”
— Councillor Aaron Paquette (he/him) (@AaronWardDene) September 28, 2022
We have far more clear and sunny days in Alberta without that deep freeze of cold than you might think.
In other Northern Cities, people bike year round because the infrastructure allows it. People bike year round in Edmonton, as well.
We also walk. pic.twitter.com/HSeey3Jo99
How many People Bike
Edmonton’s last comprehensive travel survey was completed in 2015. This survey was completed between late September and December, when the average temperature was only 4°C, with lows hitting -20°C. The survey found about 2% of trips were made by bicycle. This was also before Edmonton had any protected bike infrastructure, which only started appearing in 2017.
Census results, which only ask for the “main mode of transportation a person uses to travel to their place of work” undercount cycling, as a person who exclusively bikes 5 months of the year and drives the rest would count as 0% bike. Additionally, in Edmonton, 65% of daily bike trips are not for work, so aren’t represented in census figures, even though they are important for daily living, and affect our road usage. This is especially true for women, who continue to have a disproportionate share of non-work trips for childcare, groceries, and shopping.
We know that cycling has been steadily increasing, with cycling trips more than doubling between 2005-2015, and then doubling again along the downtown bike grid between 2016-2017. Since then even more people have started cycling, and cycling more, as the bike network expands, with another surge in 2020 during the start of the pandemic.
The City of Edmonton publishes real-time, automated counts of bicycle trips along many routes, showing steady growth since 2018.

It’s also important to remember that allocating funding strictly as a proportion of trips isn’t necessarily the best way to achieve the City’s goals. If we want to encourage more cycling, so that the City can save money overall and attract employers, we should allocate more to cycling infrastructure. And if we want to ensure that Edmonton is an equitable city where people can have mobility and everyone can participate in society, we need to ensure that we provide safe choices.
How does City Hall and the budget process work?
The City budgets in 4-year cycles. Administration has developed a proposal for 2023-2026, released at the end of October 2022. Two main budgets are proposed:
The Capital Budget pays for the things the City builds, such as building and maintaining infrastructure
The Operating Budget pays for providing programs and services
This year a Carbon Budget has also been proposed.
We’re focused on the Capital Budget, as that’s what would pay for most of the Bike Plan implementation.
The Capital Budget includes projects (“profiles”) that are already approved for funding, and potentially in progress. It also includes projects that Administration has recommended as priorities for funding. The budget also includes projects that have a phased approach, where an earlier phase may be complete, but future phases are waiting for funding approval. Finally, the budget lists projects that are “Unfunded”, which are not being advanced by Administration as priorities for funding.
Council then has opportunity to examine the proposals and make changes based on their priorities and what they hear from constituents. They can remove funding from projects that are marked as “Funded”. They could choose to reallocate funding to projects that were “Unfunded”, or find other ways to fund projects. They can also change the amounts, reducing or increasing funding without entirely cancelling projects.
You, as a member of the public, have the opportunity to call or write your councillor, all of the other councillors (who also represent the interests of the whole city), and the Mayor. You can also register to speak at public hearings held on November 28 and 29 (you can choose to speak in-person or remote).
Starting November 30, individual Councilors will put forward the changes that they wish to make, and Council as a whole will vote on each change. This process can last several weeks, but will finish before the end of December. In order to pass, the majority of Council needs to support a change.
Here are some highlights from the proposed 2023-2026 Capital Budget, as well as some follow-up questions from Councillors with answers from Administration: